Coastal Physical Processes
Wind is the driving force behind waves and currents which move sediment along the coast. Coastal processes is a term applied to describe these forces and how they change and shape our coastal shores.
Waves and Currents are the two principle forces driving shore/beach change.
Quick Links to Topics:
- Wave Characteristics
- Wave Vocabulary
- Why Do Waves Break?
- Analysis of Wave Data
- Forces that Drive Shoreline Erosion
- Tides and Water Levels
Wave Characteristics:
Waves approaching the Texas Coast are, in general, wind-generated. All waves, no matter how large or small, have a few fundamental characteristics in common.
The following is a diagram of a wave traveling through the water before it starts to break as it approaches the nearshore:
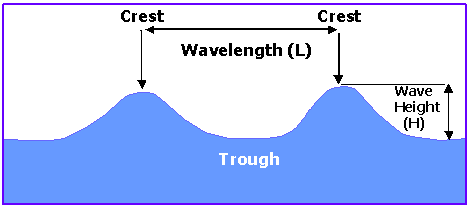
The sinusoidal, or snake like, pattern of a wave is the signature of all waves. The surface of the ocean or a lake that an observer sees is the net result of all the different waves that are traveling through the water at any given moment. The sea or large water body surface is a composite of all the different waves. Thus, the sea surface is the result of a series of sinusoidal wave patterns all with different wave lengths and wave heights. The complex wave we observe is made up of all the simple waves added together.
Waves interfere or travel through each other and when doing so they may add to each other’s height or they may cancel each other out. Constructive interference is when two waves add together making one wave that is bigger. Destructive interference is when two waves cancel each other out, making a smaller wave than each individual wave.
Wave Vocabulary:
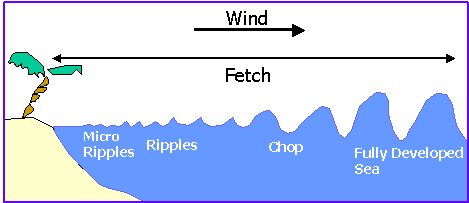
Fully Developed Sea – a given wind speed can only generate waves of a certain size. In other words, after a period of time, the waves can get no bigger. The waves are described as fully formed and are the largest waves that can be created for a given wind speed. Once formed, this swell travels indefinitely, altered only by friction with the bottom or obstacles, such as islands or continents.
Wave – a disturbance caused by the movement of energy from some source through some medium. The disturbance can sometimes be viewed as a “hump” in the medium. The traveling “hump” produces the appearance of movement that we see as a wave.
Water Wave – a disturbance caused by the movement of energy due to wind forcing, volcanic activity or earthquake through water.
Wave Crest – the highest part of a wave.
Wave Frequency – the wave frequency is defined as the number of waves passing a fixed point in a given amount of time. If we take a stopwatch, count the number of waves that pass a fixed point over a 30-second interval and divide by 30 then you have the wave frequency. Wave frequency is important to ocean engineers and architects who construct jetties, piers, and other anthropogenic (human-made) objects in or near the ocean.
Wave Trough – the lowest part of a wave.
Wave Height – vertical distance between the trough and the crest of a wave.
Wavelength – horizontal distance between the successive crests of a wave.
Wave Period – time interval between the passage of successive crests at a stationary point. For example, if you stand on the end of a pier, start your stopwatch when a wave hits a fixed spot, and stop your stopwatch when the next wave hits that point, you will have measured the wave period. The wave period can provide important clues about surf conditions. Long-period waves tend to be larger and stronger, while short-period waves are smaller and less energetic. Surfers measure the period of waves to get an idea of the swell to follow within the next several hours. Generally, longer period waves contain travel longer distances, have more energy, and create higher breakers on the shore.
Wave Base – maximum depth to which waves move the water; equals about half of the wave length.
Wave Trains – The generation of waves from the time the wind starts blowing to the time that fully-developed seas are achieve yields a series of waves with different wave periods and speeds. Since the longer period waves tend to be faster, these waves move out ahead of the rest of the waves. This is how groups of wave trains develop. A wave train is a group of waves traveling at the same speed across the ocean. These waves, obviously, hit the beach at the same time and, hence, create the well-known phenomenon of wave sets.
Wave Speed – The speed of a wave is simply how far it moves in a given amount of time. There is a close relationship between wavelength and speed. Small waves tend to move slowly at a few knots (1 knot equals 1 nautical mile per hour). Medium-size waves may move at tens of knots; large waves move 30 – 50 knots and more. Tsunamis, which are the largest waves of all, can reach speeds up to 450 knots.
Back to Top of Page
Why Do Waves Break?
Waves break as they encounter shallow water because the “bottom” portion of the wave hits either the nearshore shelf or reef while the “top” portion of the wave continues to move forward and ultimately steepens and falls over. The condition for wave breaking is when a wave reaches the shore and enters water that is approximately 1.3 times as deep as the wave is high. At this depth the wave becomes unstable and crest is thrown forward into what we observe as white water and turbulence. The reason a wave breaks is that the wave becomes overly steep, particularly at the peak of its crest. This over steepening is due to the water particles in the wave crest exceeding the velocity of the wave form. In this situation the the crest surges ahead resulting in the breaking wave.
Three “Types” of Breaking Waves
- Spilling Breakers – Very flat nearly horizontal beach
- Plunging Breakers – Steep beach
- Surging Breakers – Very steep beach
The Gulf of Mexico and specifically Texas barrier island beaches are sculpted by spilling breakers and the currents generated by these waves. Spilling breakers are waves that gradually peak until the crest becomes unstable and cascades down in bubble and foam known to most as “white water”. Plunging breakers describes a wave where the wave face becomes vertical and then curls over plunging forward and downward as an intact mass of water (such waves are generally observed on the Hawaiian and California coasts). Surging breakers look like they are going to plunge but then the base of the wave runs up the beach face resulting in the collapse and disappearance of the crest.
Surf Zone – nearshore area in which bore-like waves occur following wave breaking. This portion of the nearshore extends from the inner breakers shoreward to the swash zone.
Swash Zone – nearshore area of the beach face that is intermittently covered by run-up of the wave swash and then exposed by the backwash.
Incident Wave – Waves approaching the shoreline at angles rather than perpendicular to the shoreline.
Analysis of Wave Data:
After wave data is collected the analysis of that data is typically approached through either:
- Statistical Analysis (Zero Crossing Analysis)
- Spectral Analysis
Statistical Analysis – provides basic information on the wave climate such as maximum wave height of the record, average wave height and root mean-square wave height.
A generally accepted method applied to extract representative statistics from raw wave data is the zero crossing method. According to this method, waves are defined as the portion of a record between two successive zero up crossings. For each recorded burst of wave data the waves are ranked by height (with their corresponding periods), and the following statistics computed:
- H10 Average height of the waves, which comprise the top 10% of record.
- Maximum Wave Height (Hmax) – Maximum wave height for a given interval of time (typically 17 or 20 minutes).
- Mean Wave Height (Hmean)
- Mean Period or Zero crossing period (Tz)
- Root Mean Square Wave Height (Hrms)
- Significant Wave Height (Hsig) – Average of the highest one third of the waves measured over a given interval of time. It has been shown that significant wave height corresponds to a visual estimate of waves in that the observer tends to place more emphasis on larger waves. This statistical measurement gained usage based on the impression that in many applications the larger waves are more “significant” than than smaller waves and thus the significant wave height is more representative than the average wave height.
- Significant Wave Period (Tsig) – Average period of the highest one-third of the waves determined from large, well defined groups of waves.
Wave analysis by the zero crossing method has limitations, one of which is that the wave period is poorly defined. For example, analysis of a swell with a dominant period of 10 seconds will show a reduction in Tz if locally generated sea is superimposed. Structure and beach response may be strongly dependent on wave period. In these cases an analysis which accounts for all components of wave period, such as spectral analysis, should be used.
Spectral Analysis – also referred to harmonic analysis, provides a tool capable of generating information on the complicated mixture of waves produced by different storms. Spectral analysis is based on the mathematics of Fourier. Spectral analysis better describes the complete distributions of wave energies and periods than does statistical analysis.
Spectral analysis works backward from the complexity of a wave climate to determine the simple components that combine to produce complex wave signals.
Another simplified way to describe spectral analysis is that it provides a method to examine the energy level of a range of wave periods. Spectral analysis makes it possible to determine the period of the waves with the most energy. This statistic (TP1), yields a more representative wave period for ocean waves than what the zero crossing method can provide.
Directional Wave Spectrum provides the most complete description of a wave climate. This type of analysis provides direction of wave approach as well as the wave energy at a specific period or frequency. The approach angle of waves is instrumental in the generation of currents and transport.
Forces that Drive Shoreline Erosion
Wind-generated waves are important as energy transfer agents along Gulf Coast beaches as well as inland bays. Waves obtain energy from the wind, transfer it across expanse of the ocean or bay and deliver it to the nearshore coastal region. Here the energy is the focused and can cause erosion, generate a nearshore currents and sediment transport patterns. Although we focus on wave energy here transport by wind (Eolian transport) and anthropogenic (human-made) actions may also contribute to coastal erosion.
Waves begin as micro ripples as the wind first touches the smooth water surface. Once micro ripples are formed the wind has something to work with and the resulting friction causes the formation of ripples and chop. If the wind has enough fetch and time over which to act a fully developed sea will be produced.
Understanding the offshore wave climate helps scientists to predict the strength of nearshore currents that the waves will generate. These nearshore currents have beneficial as well as destructive aspects. While nearshore flushing is beneficial to the water quality of the nearshore waters the same strong alongshore and offshore directed currents are often associated with coastal erosion.
In the nearshore, water and thus sediment movement are dominated by two wave-induced current systems:
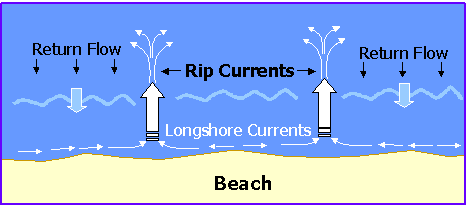
A cell circulation system consisting of rip currents and associated longshore currents. Rip currents are strong narrow surface currents that occur when waves pile more water along the shore than can be returned to the ocean causing the water to rush straight out from the shoreline in a narrow band. Sediment transported by offshore directed rip currents is generally deposited offshore outside of the nearshore.
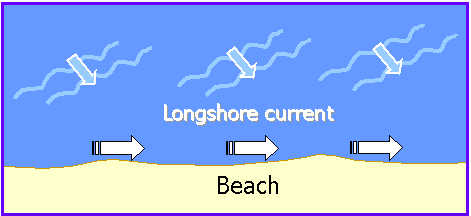
Longshore currents, also referred to as littoral currents, occur in the nearshore and are generated by an oblique (also called incident) wave approach to the shoreline. Waves breaking at appreciable angles (oblique) to the shoreline generate longshore currents that flow parallel to the shore within the confined region between the shore and breakers. The front part of the wave touches the shallow nearshore first and slows down. The remaining section of the wave bends as it approaches the nearshore creating a current that parallels the beach. Larger waves tend to strike the beach less often and at greater angles thereby creating stronger longshore currents. A good indicator that a longshore current exists along a shoreline is if sandbars are present. These longshore currents are most significant in causing a longshore movement of beach material which can consist of hundreds of kilometers of sediment. This shore parallel movement of sediment is called longshore transport.
Nearshore sediment is disturbed and suspended in the water by breaking waves is then transported either offshore by rip currents or alongshore by longshore currents. A different process is responsible for sand transport at the shoreline and sub-aerial (typically dry portion) of the beach. This process is called Beach Drift.
Beach drift occurs along the shoreline when waves reach the shore at an angle (not parallel) causing the swash and entrained sediment to travel obliquely up the beach. The returning backwash moves back to the ocean with a direction that is defined by the slope of the beach but roughly perpendicular to the shore. The differences in the direction of the swash and backwash cause a net longshore movement of sediment.
Longshore Drift is the movement of sediment along the coast in a preferred direction that is typically in response to a predominant wind direction. Longshore drift encompasses the entire region of the beach and nearshore thus incorporates the action of both beach drift and longshore sediment transport.
Direct wave action and often associated elevated water levels and longshore currents produced by incident waves are the primary factors resulting in coastal erosion along the Texas Coast. Waves are the primary force causing erosion along the coast. Waves cause erosion in two ways, 1) Direct impact with the shoreline and 2) Formation of wave induced longshore currents. An observer can witness shoreline erosion as the forceful waves directly impact the shoreline. The second mechanism of erosion is less apparent to the naked eye. A longshore current develops when incident waves approach the beach. As the front part of the wave hits the shallow water the wave slows down. The rest of the wave bends as it comes closer to the shore creating a current that parallels the beach. The current is directed alongshore away from the approaching wave direction (Figure #). The longshore current carries sediment that is suspended by breaking waves along with it as it flows alongshore. Larger waves, which strike the beach less often approach at greater angles, thereby creating stronger Longshore currents. Areas with developed longshore currents are often identified by an established system of longshore sand bars.
Back to Top of Page
Tides and Water Levels
Click here to learn more about tides and water level affecting the coastal process